
It's important to understand the situation Dashbud address and the problem it solves.
The problems of traditional BI: BI is about getting answers from your data, which usually means: gathering data from multiple sources, learning complex tools, managing fragile processes, and repeating yourself. It's slow, creates bottlenecks, and frustrates and burdens business users. This process presents quite a few problems. →
Your data lives in many places: flat files (Excel, CSVs), databases (PostgreSQL, MySQL), siloed systems (ERPs, CRMs), and SaaS platforms (Stripe, QuickBooks, Google Analytics). Dashbud connects to all of these data sources. →
What is BI? A deeper dive with some foundational questions and answers. →
How Dashbud Works: AI-Powered BI
Dashbud addresses the challenges of traditional BI by automating data integration, analysis, and visualization. Our AI-powered platform simplifies the process, enabling users to get insights faster and with less effort.
Step 1: Connect Your Data Sources Once
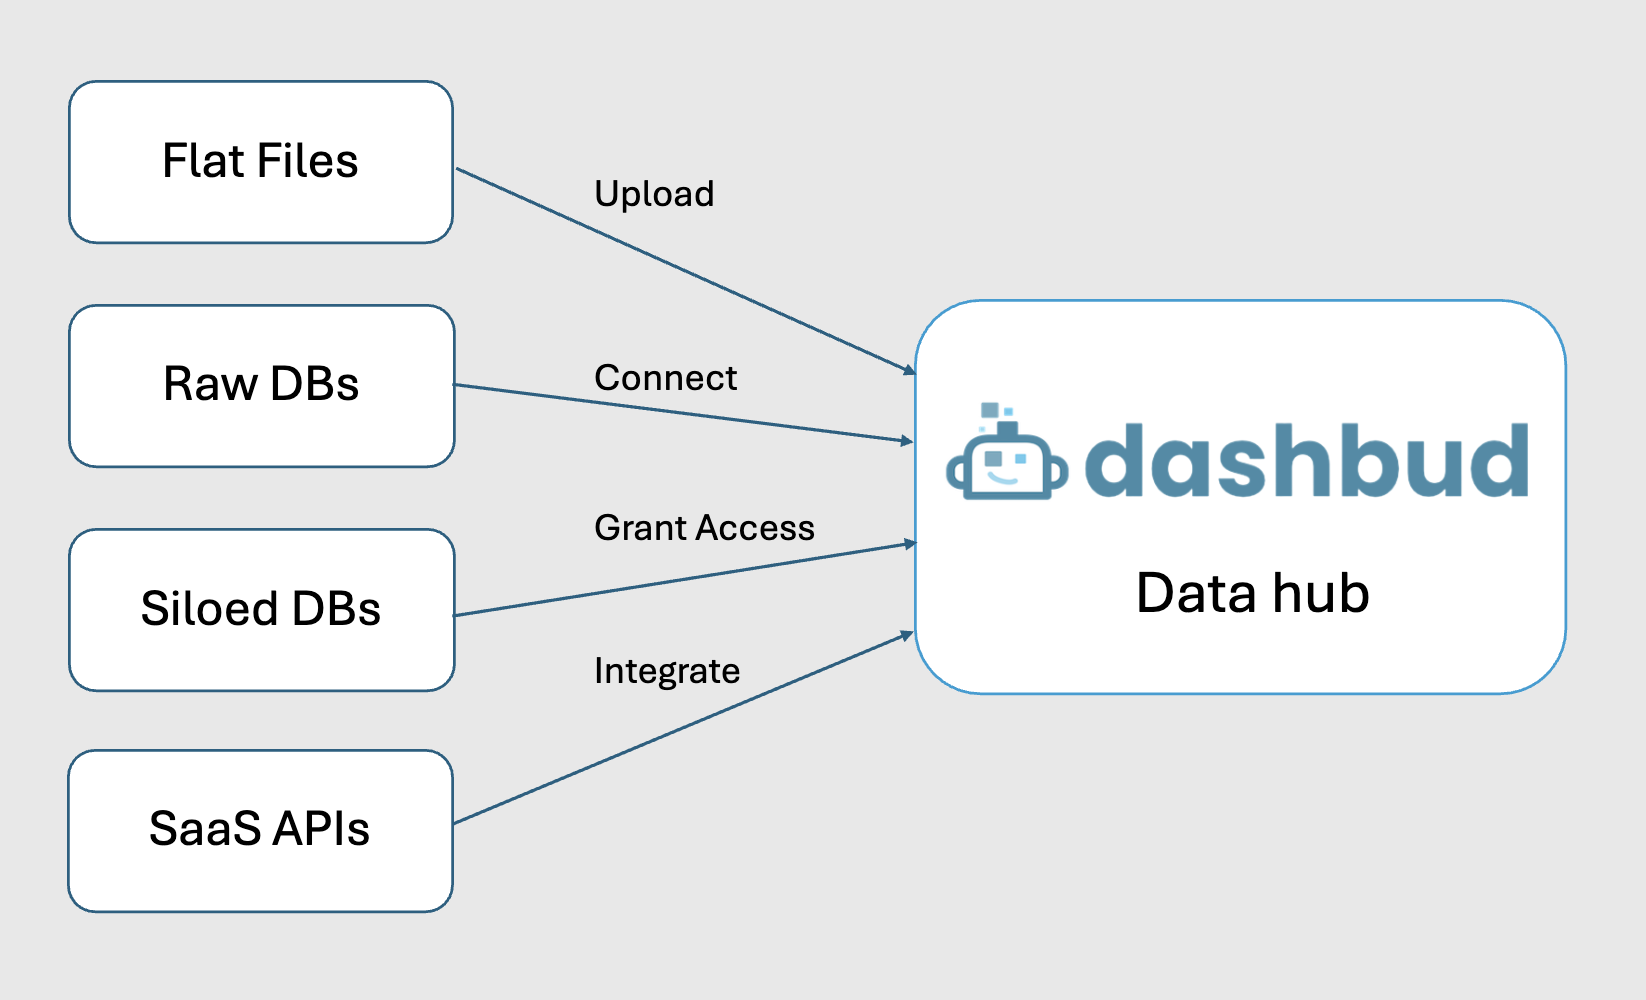
Dashbud eases data acquisition by enabling one-time access for persistent data resources, and by facilitating file uploads intelligently.
- Flat Files → Upload: Drag and drop CSV, Excel, or Google Sheets files. Smart handling of updates and built-in format change detection.
- Raw Databases → Direct Connection: Simple connection string setup (hostname, database name, credentials).
- Siloed Databases → Managed Access: Data team grants Dashbud read access once with governed permissions.
- SaaS APIs → Native Integrations: Point-and-click connection to popular platforms; automatic schema discovery and data refresh.
In all cases:
- Governance can be handled within the resource, via Dashbud, or a combination
- All queries logged and auditable for compliance
Step 2: Teach Dashbud About Your Data
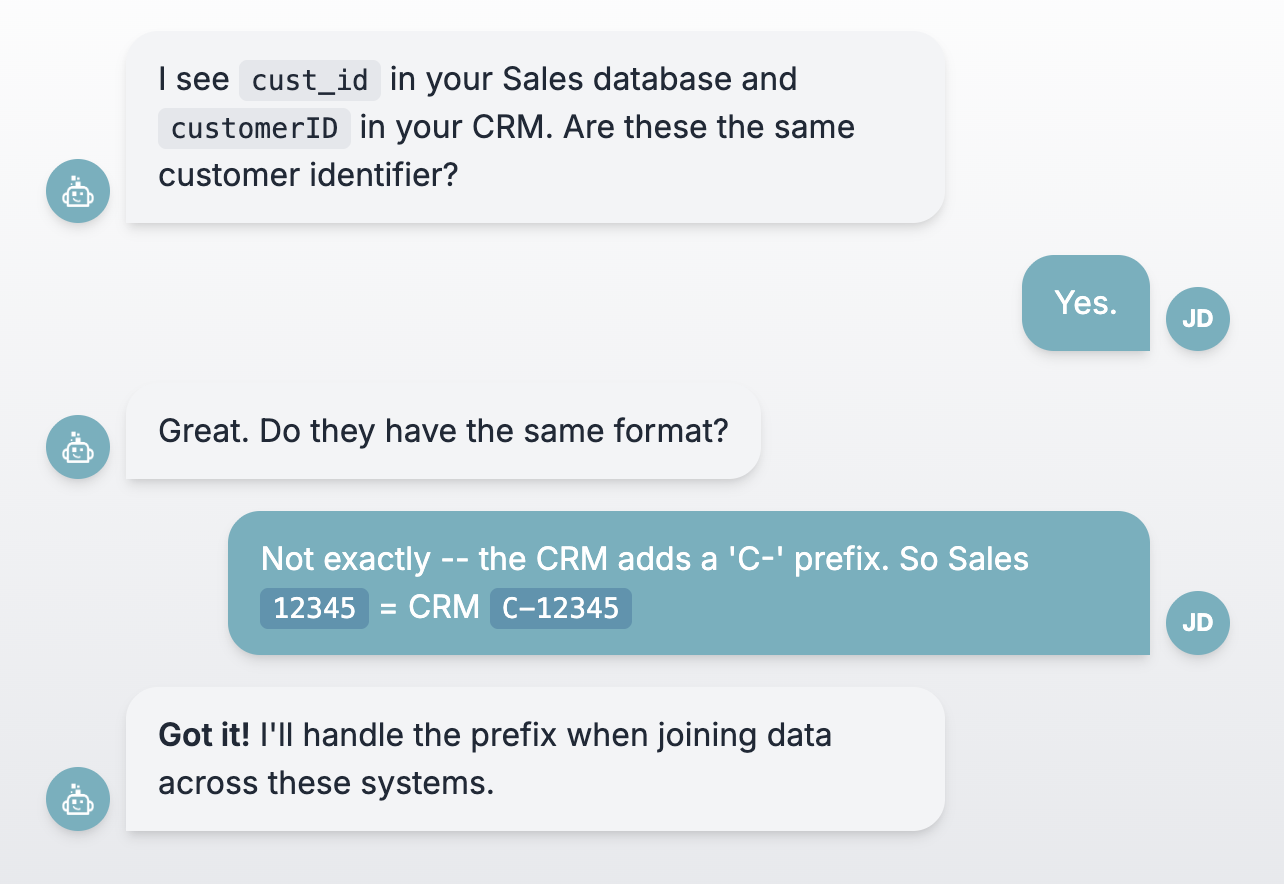
Instead of manually writing join logic and mapping fields, you have a conversation with Dashbud to create semantic 'blueprints' of your data.
The Semantic Setup Flow:
- Dashbud reads your schema (table names, column names, data types) without accessing the actual data
- Dashbud asks clarifying questions where it needs your expertise:
- Dashbud learns your business context:
- Dashbud creates reusable definitions that power all future queries
Example questions:
- • "I see 'customer_id' in your Stripe data and 'client_number' in QuickBooks. Are these the same?"
- • "What currency is the 'revenue' column in?"
- • "What timezone should we use for date calculations?"
Business context examples:
- • How many office locations you have
- • What your fiscal year looks like
- • Which fields represent the same concept across different systems
This happens once per data source. After that, Dashbud understands your data model and can intelligently query across all your resources.
Step 3: Ask Data Questions in Plain English
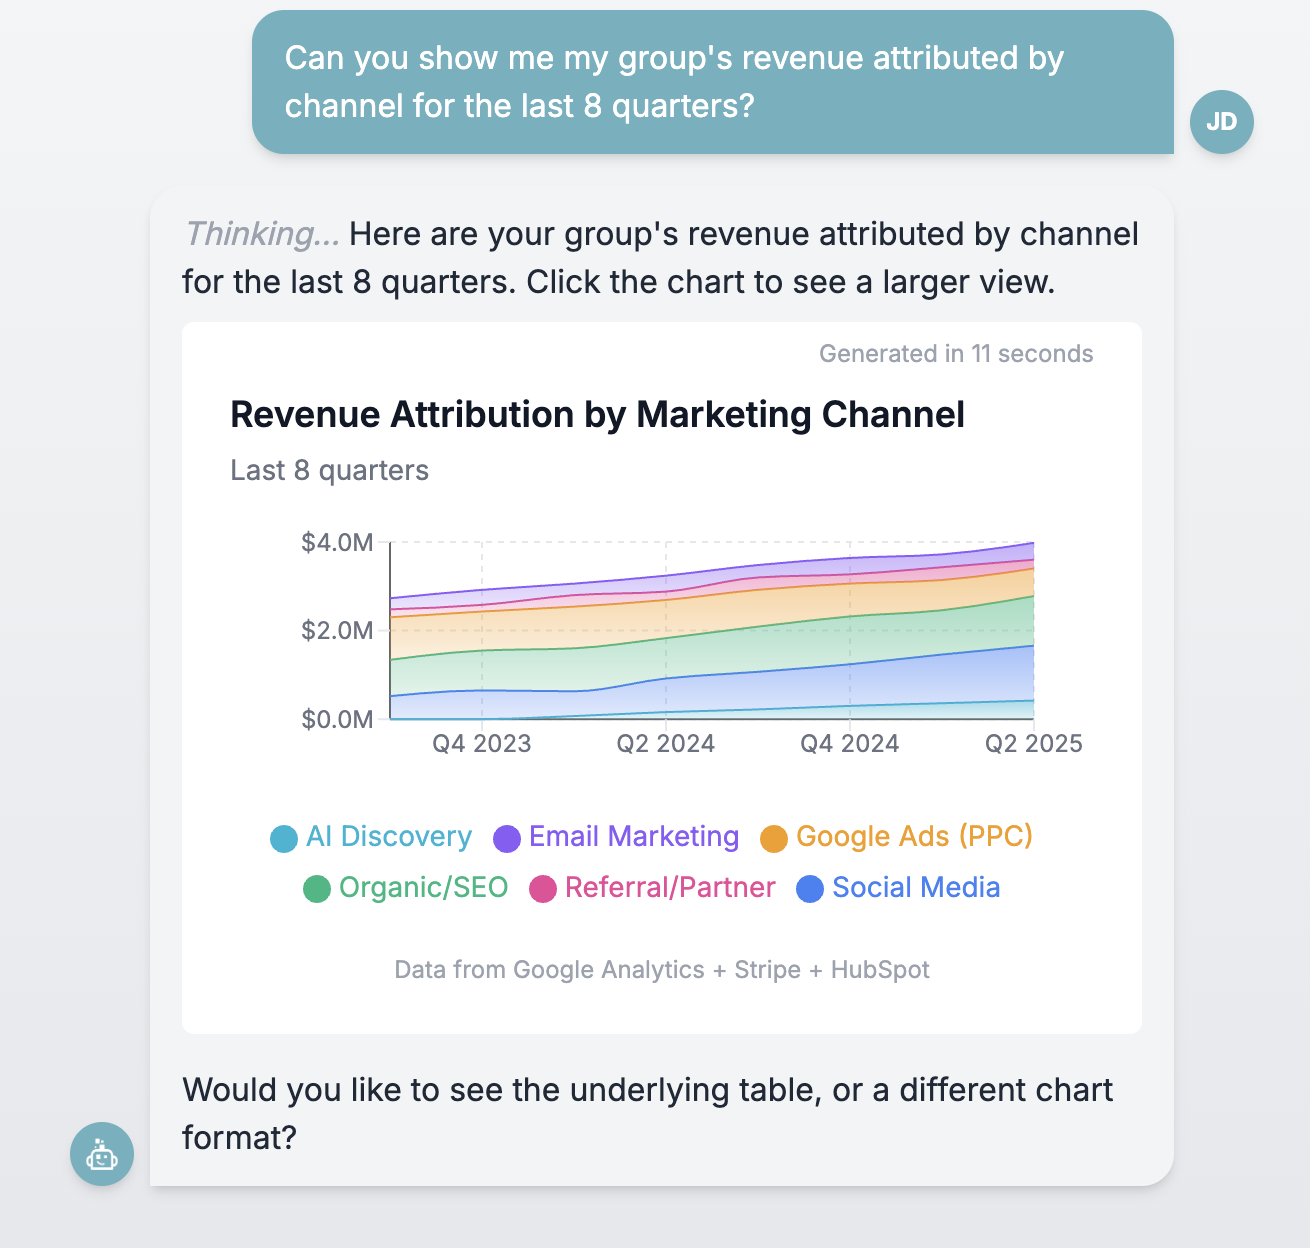
With your data connected and blueprinted, getting answers is as simple as typing what you want to know:
- "Show me revenue by metro area for Q1"
- "Which marketing channels drove the most customer signups last month?"
- "Compare inventory turnover rates across all warehouses"
- "What's our average collection time by insurance provider?"
Behind the scenes, Dashbud 1) interprets your question, 2) generates the appropriate queries across your data sources, 3) joins data correctly using your semantic blueprints, and 4) returns results as tables, charts, or both
Refine on the fly:
- • "Now break that down by product category"
- • "Show me just the top 10"
- • "Add year-over-year comparison"
No new syntax to learn. No BI tool interface to master. Just conversation.
Step 4: Save & Share Professional Outputs
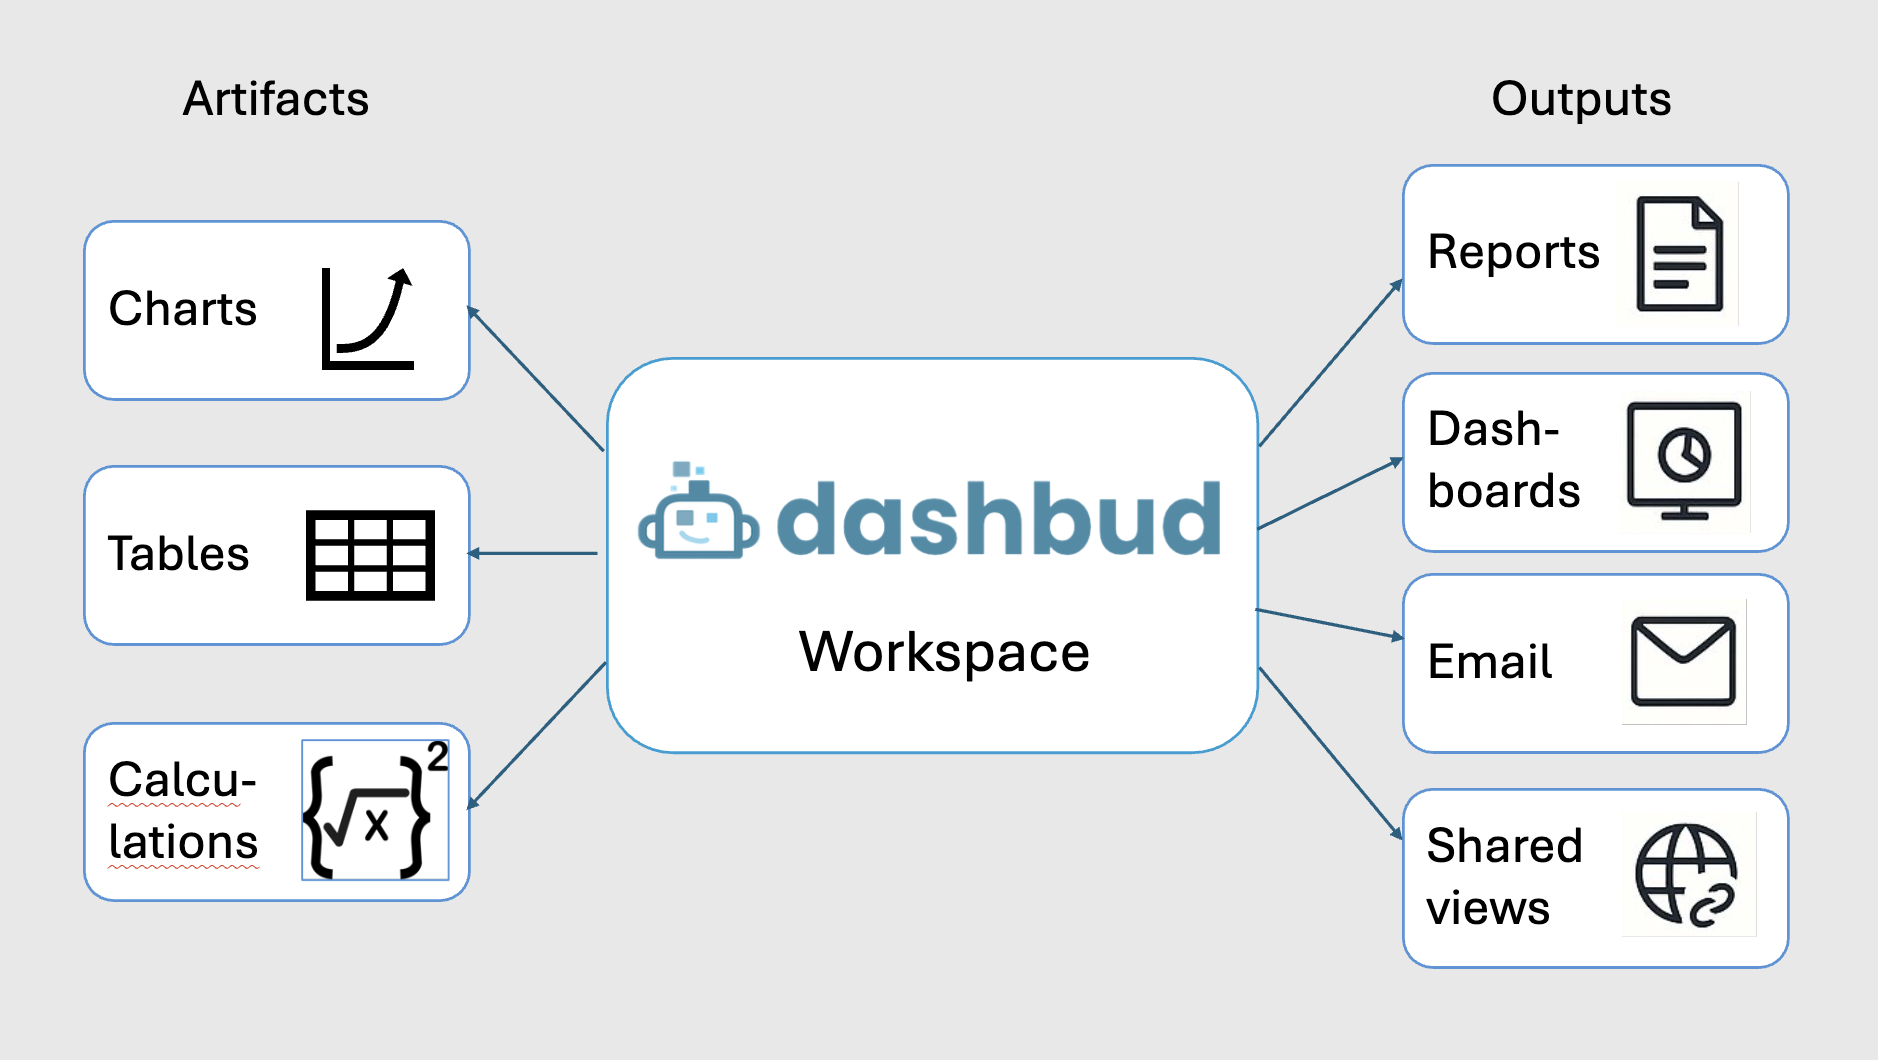
Charts and tables answer individual questions, but often you'll want to group them into a report or dashboard, whether for your own reference for sharing. Dashbud facilitates both with flexible grouping, organizing, and sharing options.
Well-organized artifacts, reports, and dashboards
- Group charts and tables into customizable reports and dashboards
- Work is organized into workspaces by default; charts and tables can be tagged for further organization
Presentation-ready outputs
- Professional-quality charts and tables with customizable colors, labels, and styling
- Export to PNG, PDF, or interactive formats
Flexible Sharing Options
- Workspaces: can be shared for in-depth collaboration
- Individual artifacts: share or export for incorporation in presentations
- Live dashboards and scheduled reports: share interactive views and send email notifications
- Share outside Dashbud: share static or live views with clients and stakeholders
Governance baked in:
- Control who sees what data
- Track who accessed which reports
- Maintain audit trail for compliance
The Dashbud Difference
From Question to Answer in Minutes, Not Days
Where you might spend a few days putting together a report using a mix of data sources – even just flat file exports – with Dashbud, you will find yourself doing the same work in minutes.
Once you have set up the data sources, the same report can be recreated with confidence periodically, and modified as needed. Even if you have to upload an additional month of data, Dashbud makes the workflow easy.
Instead, you can spend more time thinking about the reporting itself, and asking Dashbud additional questions: the Houston office had the biggest increase in sales last quarter, but which product line drove that increase? How did that compare to other offices? All answered in conversation.
Speed Without Shortcuts
Answer questions as they arise, not after they're no longer relevant. Iterate quickly without rebuilding from scratch.
Governed Self-Service
Business users get answers independently while IT maintains control. Schema-based approach means sensitive data never leaves your systems.
Accurate & Consistent
Semantic blueprints ensure everyone uses the same definitions. No more conflicting 'sources of truth' from different spreadsheets.
True Collaboration
Shared workspaces mean teams build on each other's work instead of duplicating effort. Analysts spend time on strategy instead of one-off requests.
Presentation-Ready Output
Every chart, table, and dashboard looks professional from the first run. Share with confidence whether it's an internal Slack message or an investor presentation.