Traditional BI and its Problems
Here is a brief picture of what many people go through to get answers from their data. It's a little different for everyone, depending on the sources, the business goals, and the skills and human resources of the person and company. But if you have questions that need to be answered by data, you will probably see yourself in some of the description below.
Step 1: Accessing Data
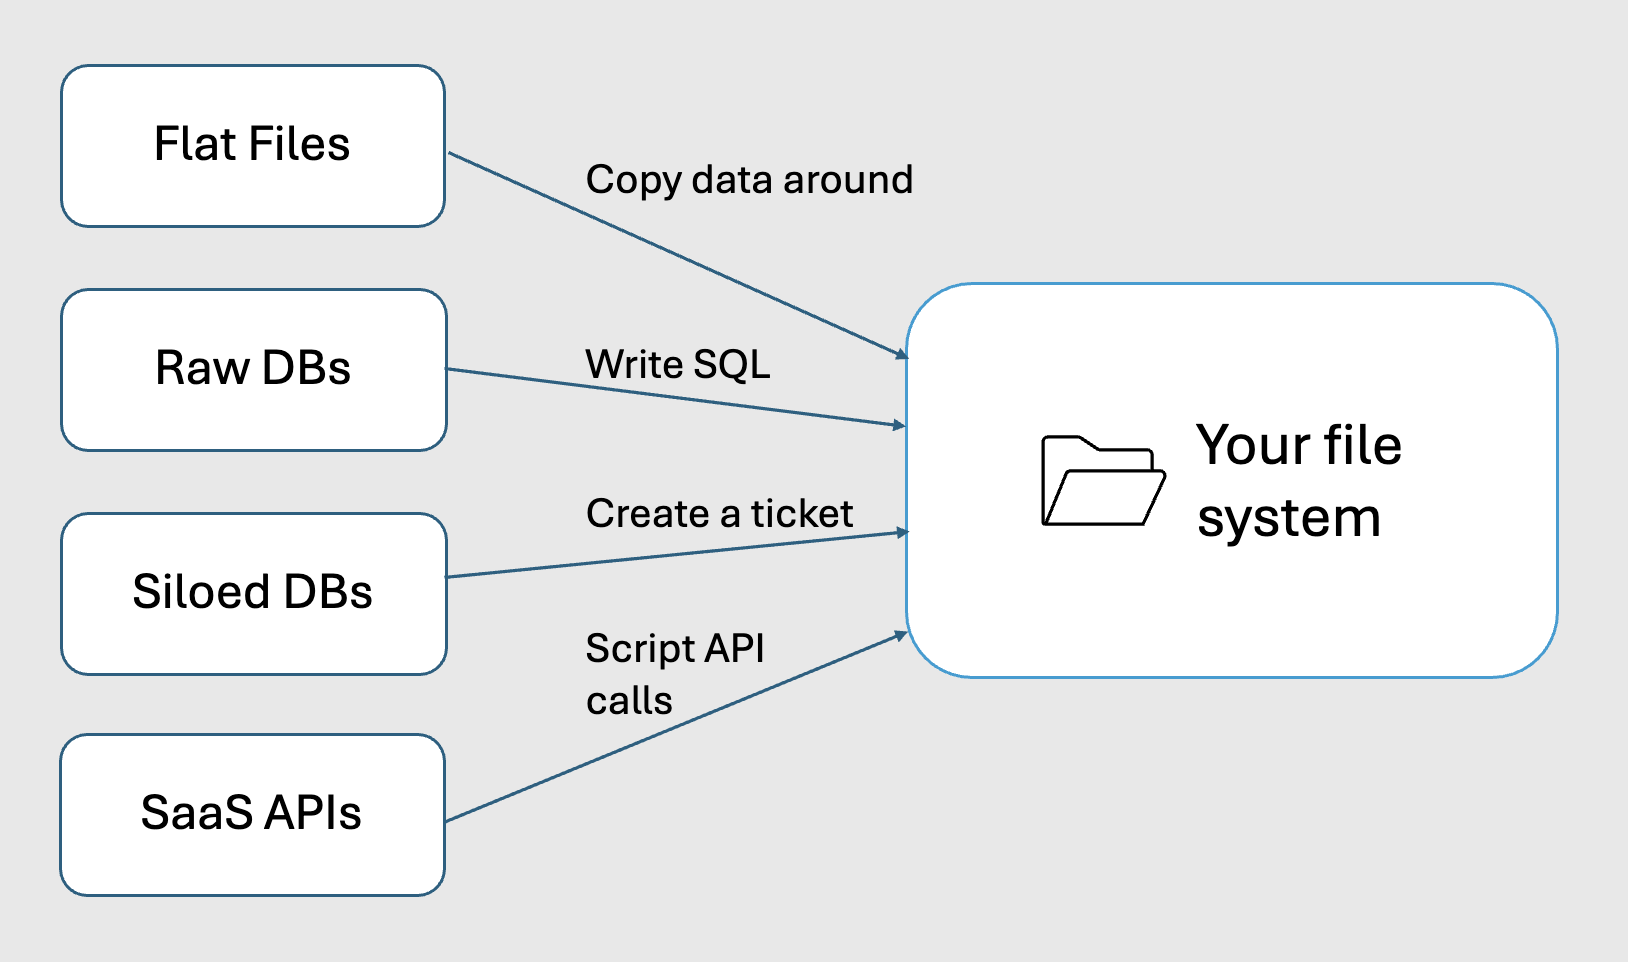
Your data needs to get from the above listed places to one location – either on your desktop or in the cloud, in order for you to analyze it and get actionable insights. Let's look at how this traditionally works.
- Flat files: Download from one or more locations, copy from local files, append to existing data, with careful attention to data format.
- Raw databases: Write SQL queries or ask someone do this for you
- Siloed databases: Submit ticket to data team and wait hours or days for an export
- SaaS APIs: Write integration scripts, manage authentication, handle pagination and rate limits
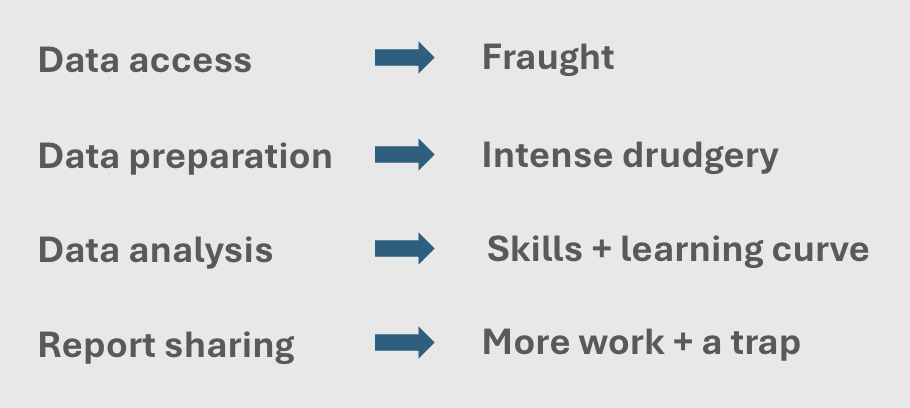
Hours are often spent gathering data before analysis even begins.
Step 2: Data Preparation/Cleaning
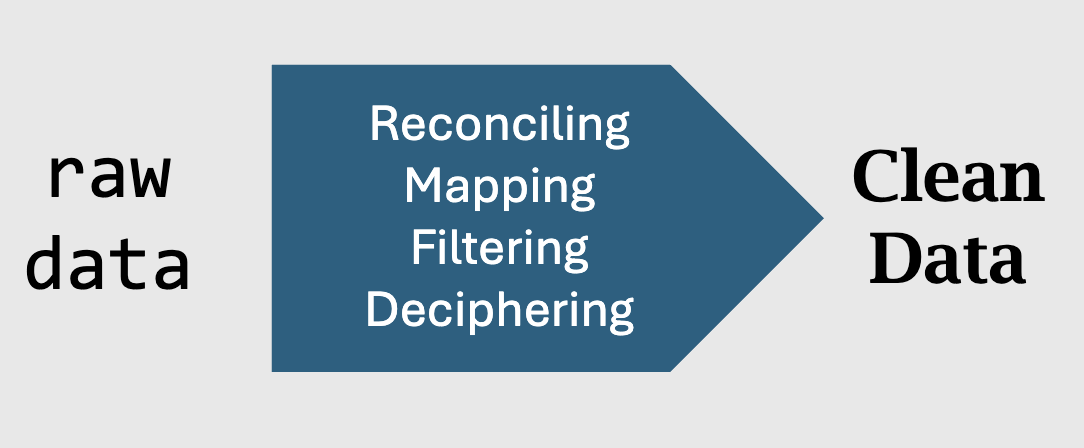
If you're collecting data from different sources, you may need to 'massage' it to make it all work together. Even data from one source may need some human-readable translation.
- Reconciling: accounting for different naming (is 'customer_id' the same as 'client_number'?) and other conventions (timezone, week-start, currency)
- Normalizing: Matching records across systems (connecting the same customer in Salesforce, Stripe, and QuickBooks)
- Filtering: excluding data that you don't need or is sensitive and should not be shared.
- Deciphering: translating native naming conventions into intuitive, human-readable words.
This could take a few minutes, or could entail hours of spreadsheet wrangling and/or notebook coding. Data cleaning is a crucial and famously arduous process even for dedicated data scientists.
Step 3: Analysis & Iteration
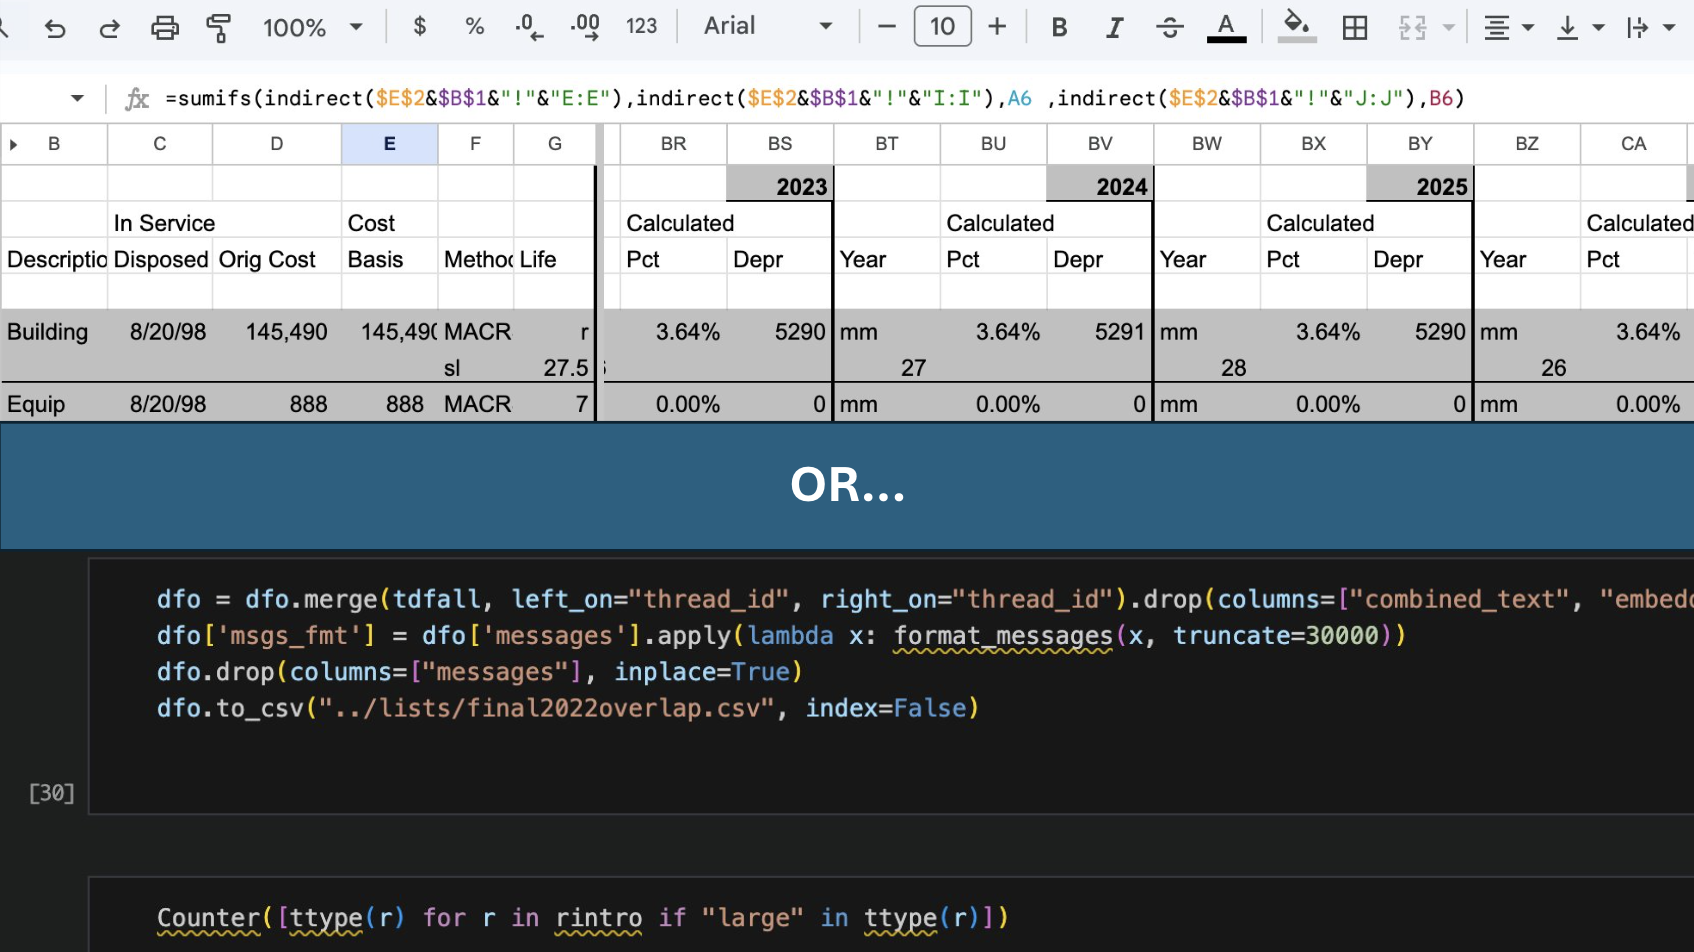
After data preparation, answering business questions requires:
- Figuring out how the question you have maps onto your data set.
- Writing code (such as Python or SQL) or learning to use the proprietary visual interface of your BI tool (point-and-click controls or spreadsheet function syntax)
- Building visualizations using the chart-building functionality of your BI system, spreadsheet, or code-based system (e.g. matplotlib)
- Re-running the entire process, or carefully modifying a complex spreadsheet or notebook, when you need new or updated information.
- OR: open a ticket and hand the entire thing off to the data team. And wait…
This is a slow, heavy process, which many business users don't have the skills to complete successfully. And those that do get sucked into an 'expertise trap' – they feel like because they can do the analysis themselves they should do it. Even worse, they may get pigeonholed as the 'numbers person' and asked to do technical work that isn't the best use of their time.
The alternative at some companies is to open a ticket with the data team for a custom report. But a one-off report for an individual or small team is unlikely to receive a high priority. And this isn't wrong – the data team should have bigger fish to fry!
Step 4: Sharing Results
When you finally have answers:
- Spreadsheets are messy—full of hidden tabs, broken formulas, and unclear provenance
- Notebooks require post-processing to hide calculation cells and export to PDF.
- Static exports must be re-sent to update, putting a burden on the author
- Shared spreadsheets likewise burdens the author unless updates are automatically
As thanks for your skills and initiative, you become a data service, fielding the same questions repeatedly.
Sound familiar? There's a better way.
Dashbud transforms this fragmented, time-consuming workflow into a streamlined, conversational experience.
See how Dashbud works →