Dashbud: a coherent system for data insights
Dashbud's AI-enhanced features work together to create a seamless experience: from connecting to data sources, to exploring your needs, to authoring dashboards, everything is designed to help you get the most from your data.

Plain Language Queries
Ask questions in natural language and get answers in real time — no SQL, no middleman.
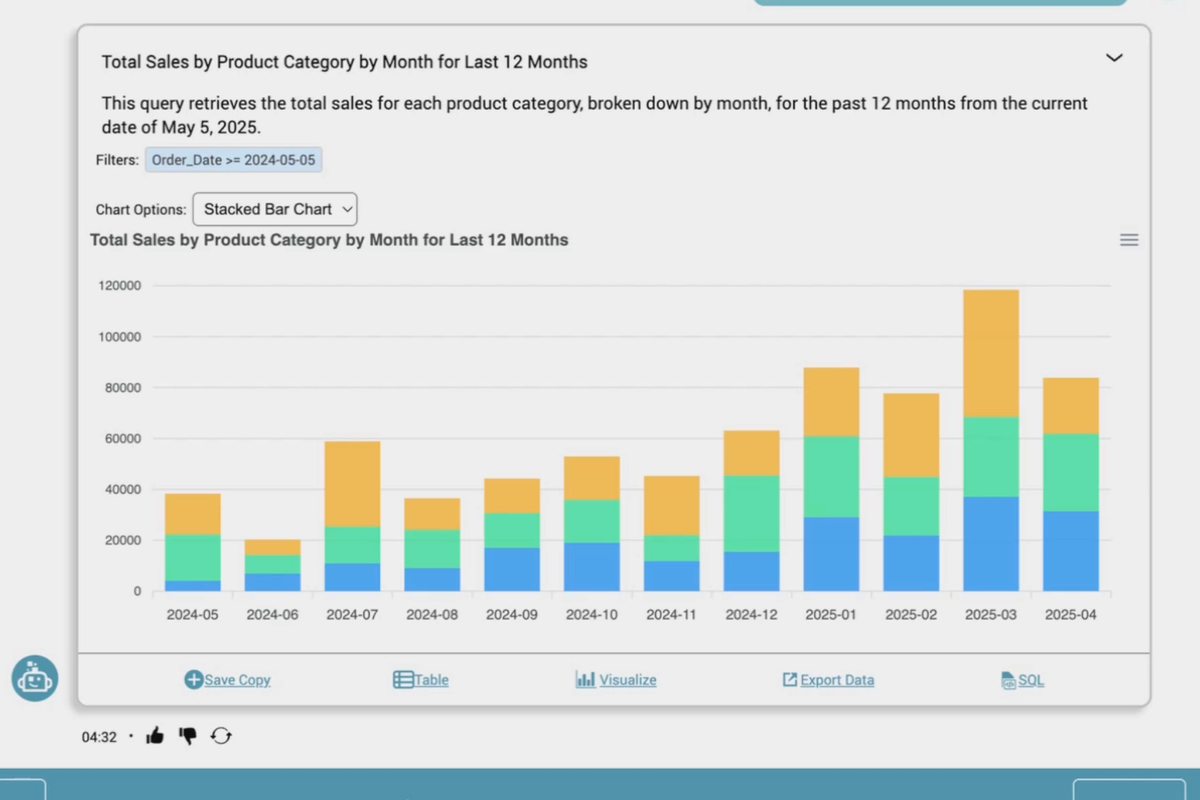
Dashbud lets you query your data like you're talking to a teammate. No technical syntax, no waiting in line for a report — just clear answers, fast.
Traditionally, creating a report means one of two things:
- Writing SQL — which requires significant technical skill
- Or slogging through a point-and-click interface in a BI tool — which is often slow, glitchy, and confusing
Dashbud removes both barriers. You simply ask a question — and Dashbud generates accurate, visual answers on the fly. For example:
- “What were our top-selling products last week?”
- “Show me revenue by ad campaign for Q2.”
- “What’s our gross margin for last month compared to the same month last year?”
By making reporting conversational, Dashbud gives business teams instant access to the answers they need — and frees up analysts to focus on deeper work.
Smart Report Recommendations
Dashbud suggests useful reports based on your data structure — so you don’t have to start from scratch.
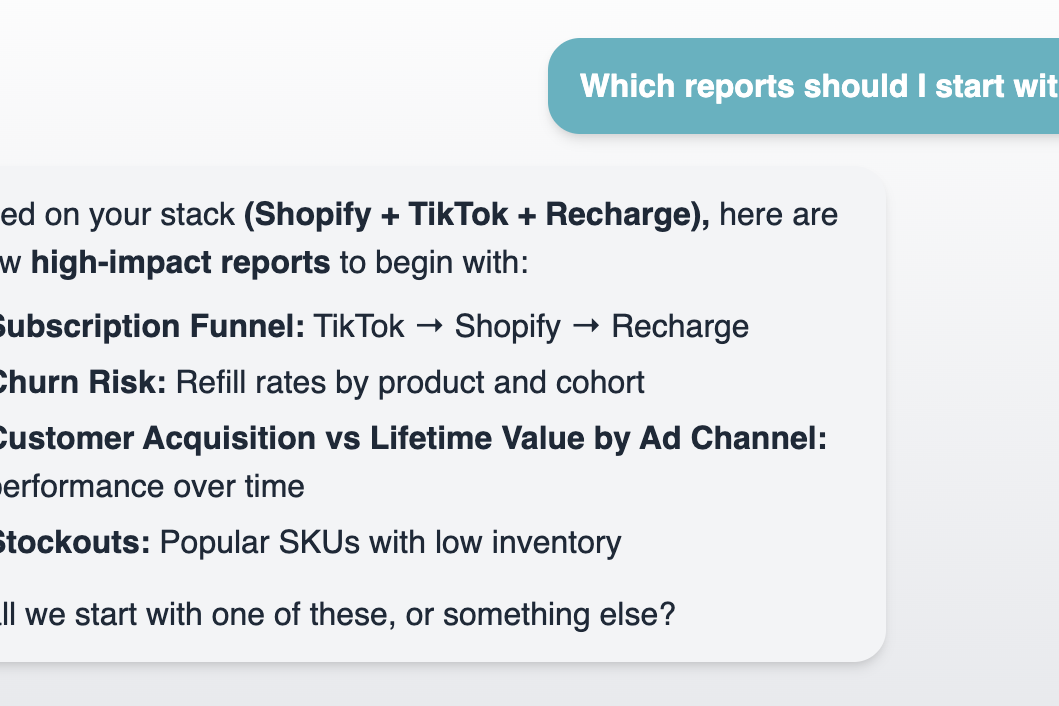
Creating reports from a blank screen is slow and intimidating — especially if you don’t know what’s possible or where to start.
Dashbud helps by offering smart report suggestions based on the structure of your data. It understands common use cases — like marketing attribution, product performance, or financial summaries — and suggests reports that businesses like yours typically need.
But unlike “canned” dashboards, these aren’t one-size-fits-all templates. You stay in the driver’s seat.
- Want a P&L by business unit for Q1? Just ask.
- Curious how revenue broke down across ad campaigns? We’ve seen that before — and we can help.
- Need a customer retention snapshot for your board deck? You’re one step away.
Dashbud brings its reporting experience to your unique data — and works with you, conversationally, to shape the exact report or dashboard you need.
Clean, Professional Outputs
Dashbud makes it easy to create presentation-ready dashboards and reports without design work.
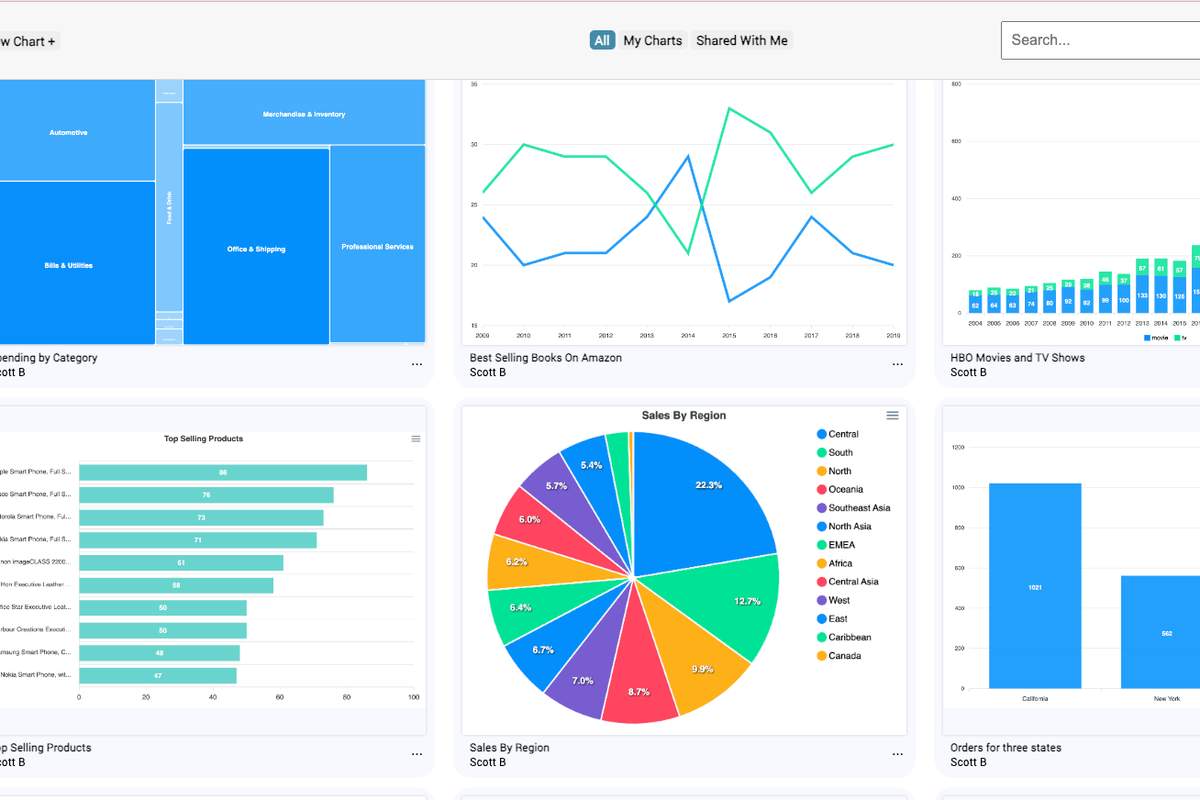
You’ve probably seen this before: a valuable insight buried in a janky chart or an Excel sheet copied into a slide deck.
Dashbud helps you move beyond that. Every report or dashboard you generate is clean, clear, and presentation-ready by default — whether it’s for internal planning, investor updates, or client-facing delivery.
No extra formatting, no tweaking colors, no rebuilding charts in PowerPoint. You get:
- Modern, responsive dashboards you can customize and share
- Beautiful, readable reports that fit your brand
- PDF and link-based sharing options that just work
It’s fast, flexible, and easy to make high-quality reporting a routine part of how your team communicates.
Organized Workspaces & Shared Projects
Keep your data, reports, and dashboards tidy and accessible with shared workspaces and project folders.
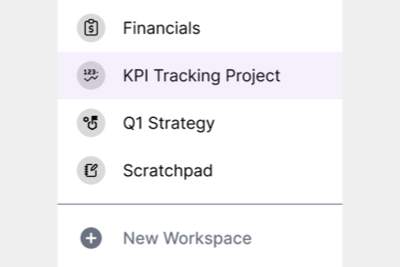
Sprawling folders. Dozens of versions. Confusing filenames like final_FINAL_v2.xlsx.
Dashbud replaces the mess with organized, collaborative workspaces where your team can build, browse, and reuse reporting assets with confidence.
- Group reports, dashboards, and data sources by project, team, or client
- Share workspaces with collaborators — no file juggling or permissions confusion
- Keep track of your most important metrics in one place
- Use templates and previous work as a starting point for new requests
It’s reporting infrastructure that actually scales as your team grows.
Connect Anything, Use Anywhere
Dashbud connects to spreadsheets, databases, APIs, and cloud services — no data left behind.
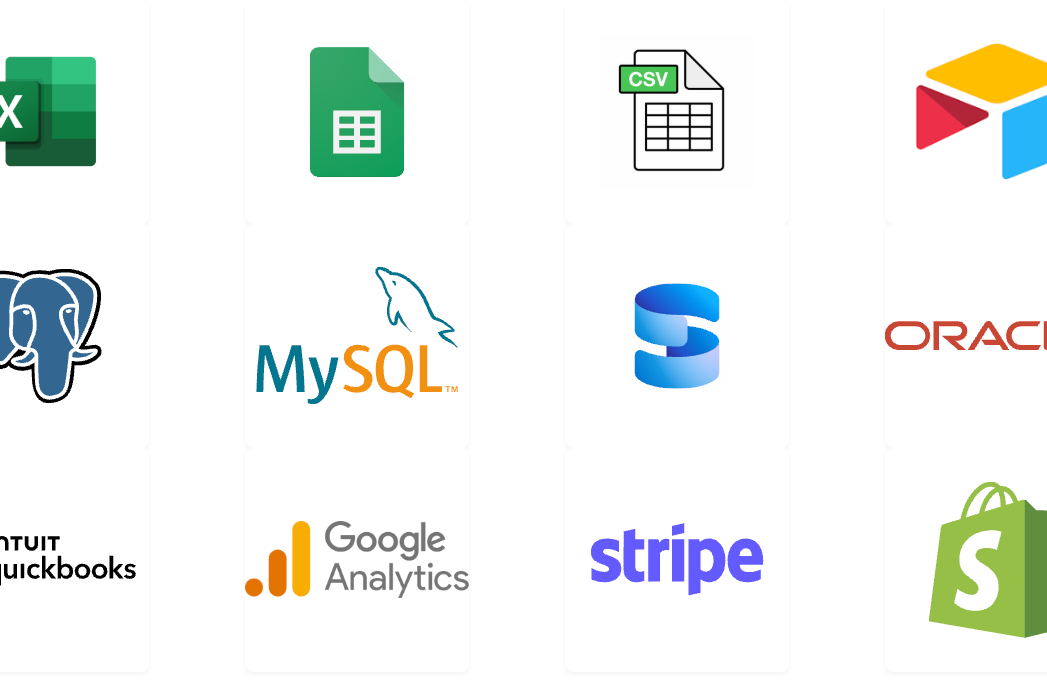
Your data is everywhere — scattered across spreadsheets, SaaS tools, cloud platforms, and legacy databases. Most reporting tools make you jump through hoops just to bring it all together.
Dashbud makes it easy to plug in whatever you're working with:
- Upload CSVs or Excel sheets
- Connect to Google Sheets or Airtable
- Sync directly with databases like PostgreSQL, MySQL, or Snowflake
- Integrate with APIs or platforms like HubSpot, Stripe, and Google Ads
Whether you're a founder with one dashboard or a data lead wrangling six sources, Dashbud adapts. No lock-in, no special formats — just clean, flexible inputs that support real work.
Ready to see how it all fits together?
Take a demo, start your free trial, and discover how easy it can be to get answers from your data resources.