
AI-powered analytics for
all your data
all your data
From a single spreadsheet to your company's entire data ecosystem, give everyone access to trusted, modern data tools.
Self-service data analysis and reports as easy as...
Ask questions in plain English
No SQL, no query builder. Just describe what you want to see.
Smart chart formatting
Dashbud selects an appropriate visualization, handles multiple series and axes, and keeps legends readable.
Refine in conversation
Break it down further, add dimensions, change the view — iterate.
Interactive controls
Parametrize any dimension and your report becomes a live, filterable tool.
Save and reuse
Save any result as a report. Build a library your whole team can use.
Build dashboards
Add saved reports to a dashboard. Drag, drop, and arrange.
Share with your team
Live, interactive dashboards for stakeholders who never need to write a query.
Ask questions in plain English
No SQL, no query builder. Just describe what you want to see.
Smart chart formatting
Dashbud selects an appropriate visualization, handles multiple series and axes, and keeps legends readable.
Refine in conversation
Break it down further, add dimensions, change the view — iterate.
Interactive controls
Parametrize any dimension and your report becomes a live, filterable tool.
Save and reuse
Save any result as a report. Build a library your whole team can use.
Build dashboards
Add saved reports to a dashboard. Drag, drop, and arrange.
Share with your team
Live, interactive dashboards for stakeholders who never need to write a query.
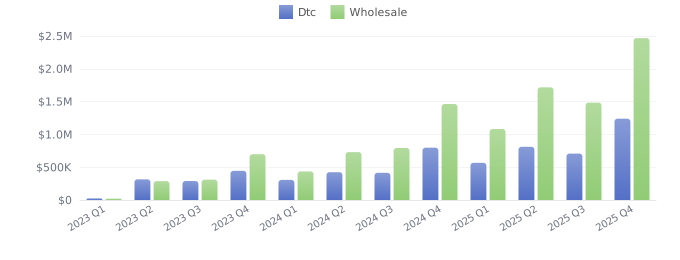
Show me quarterly profits by channel for the last three years.

Quarterly profits by sales channel, calculated by subtracting unit cost from unit price and multiplying by quantity, aggregated by sales channel and quarter.
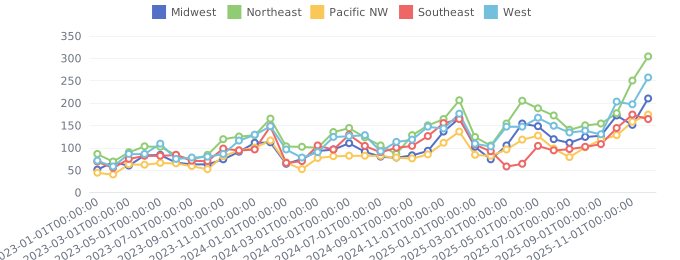
Break that down by region. Parametrize region so I can filter.
Here's the regional breakdown with an interactive filter. The Northeast leads in wholesale, while DTC is strongest in the Southeast — though note the Southeast DTC dip in early 2025:
Sales Overview
Connect Any Data Source
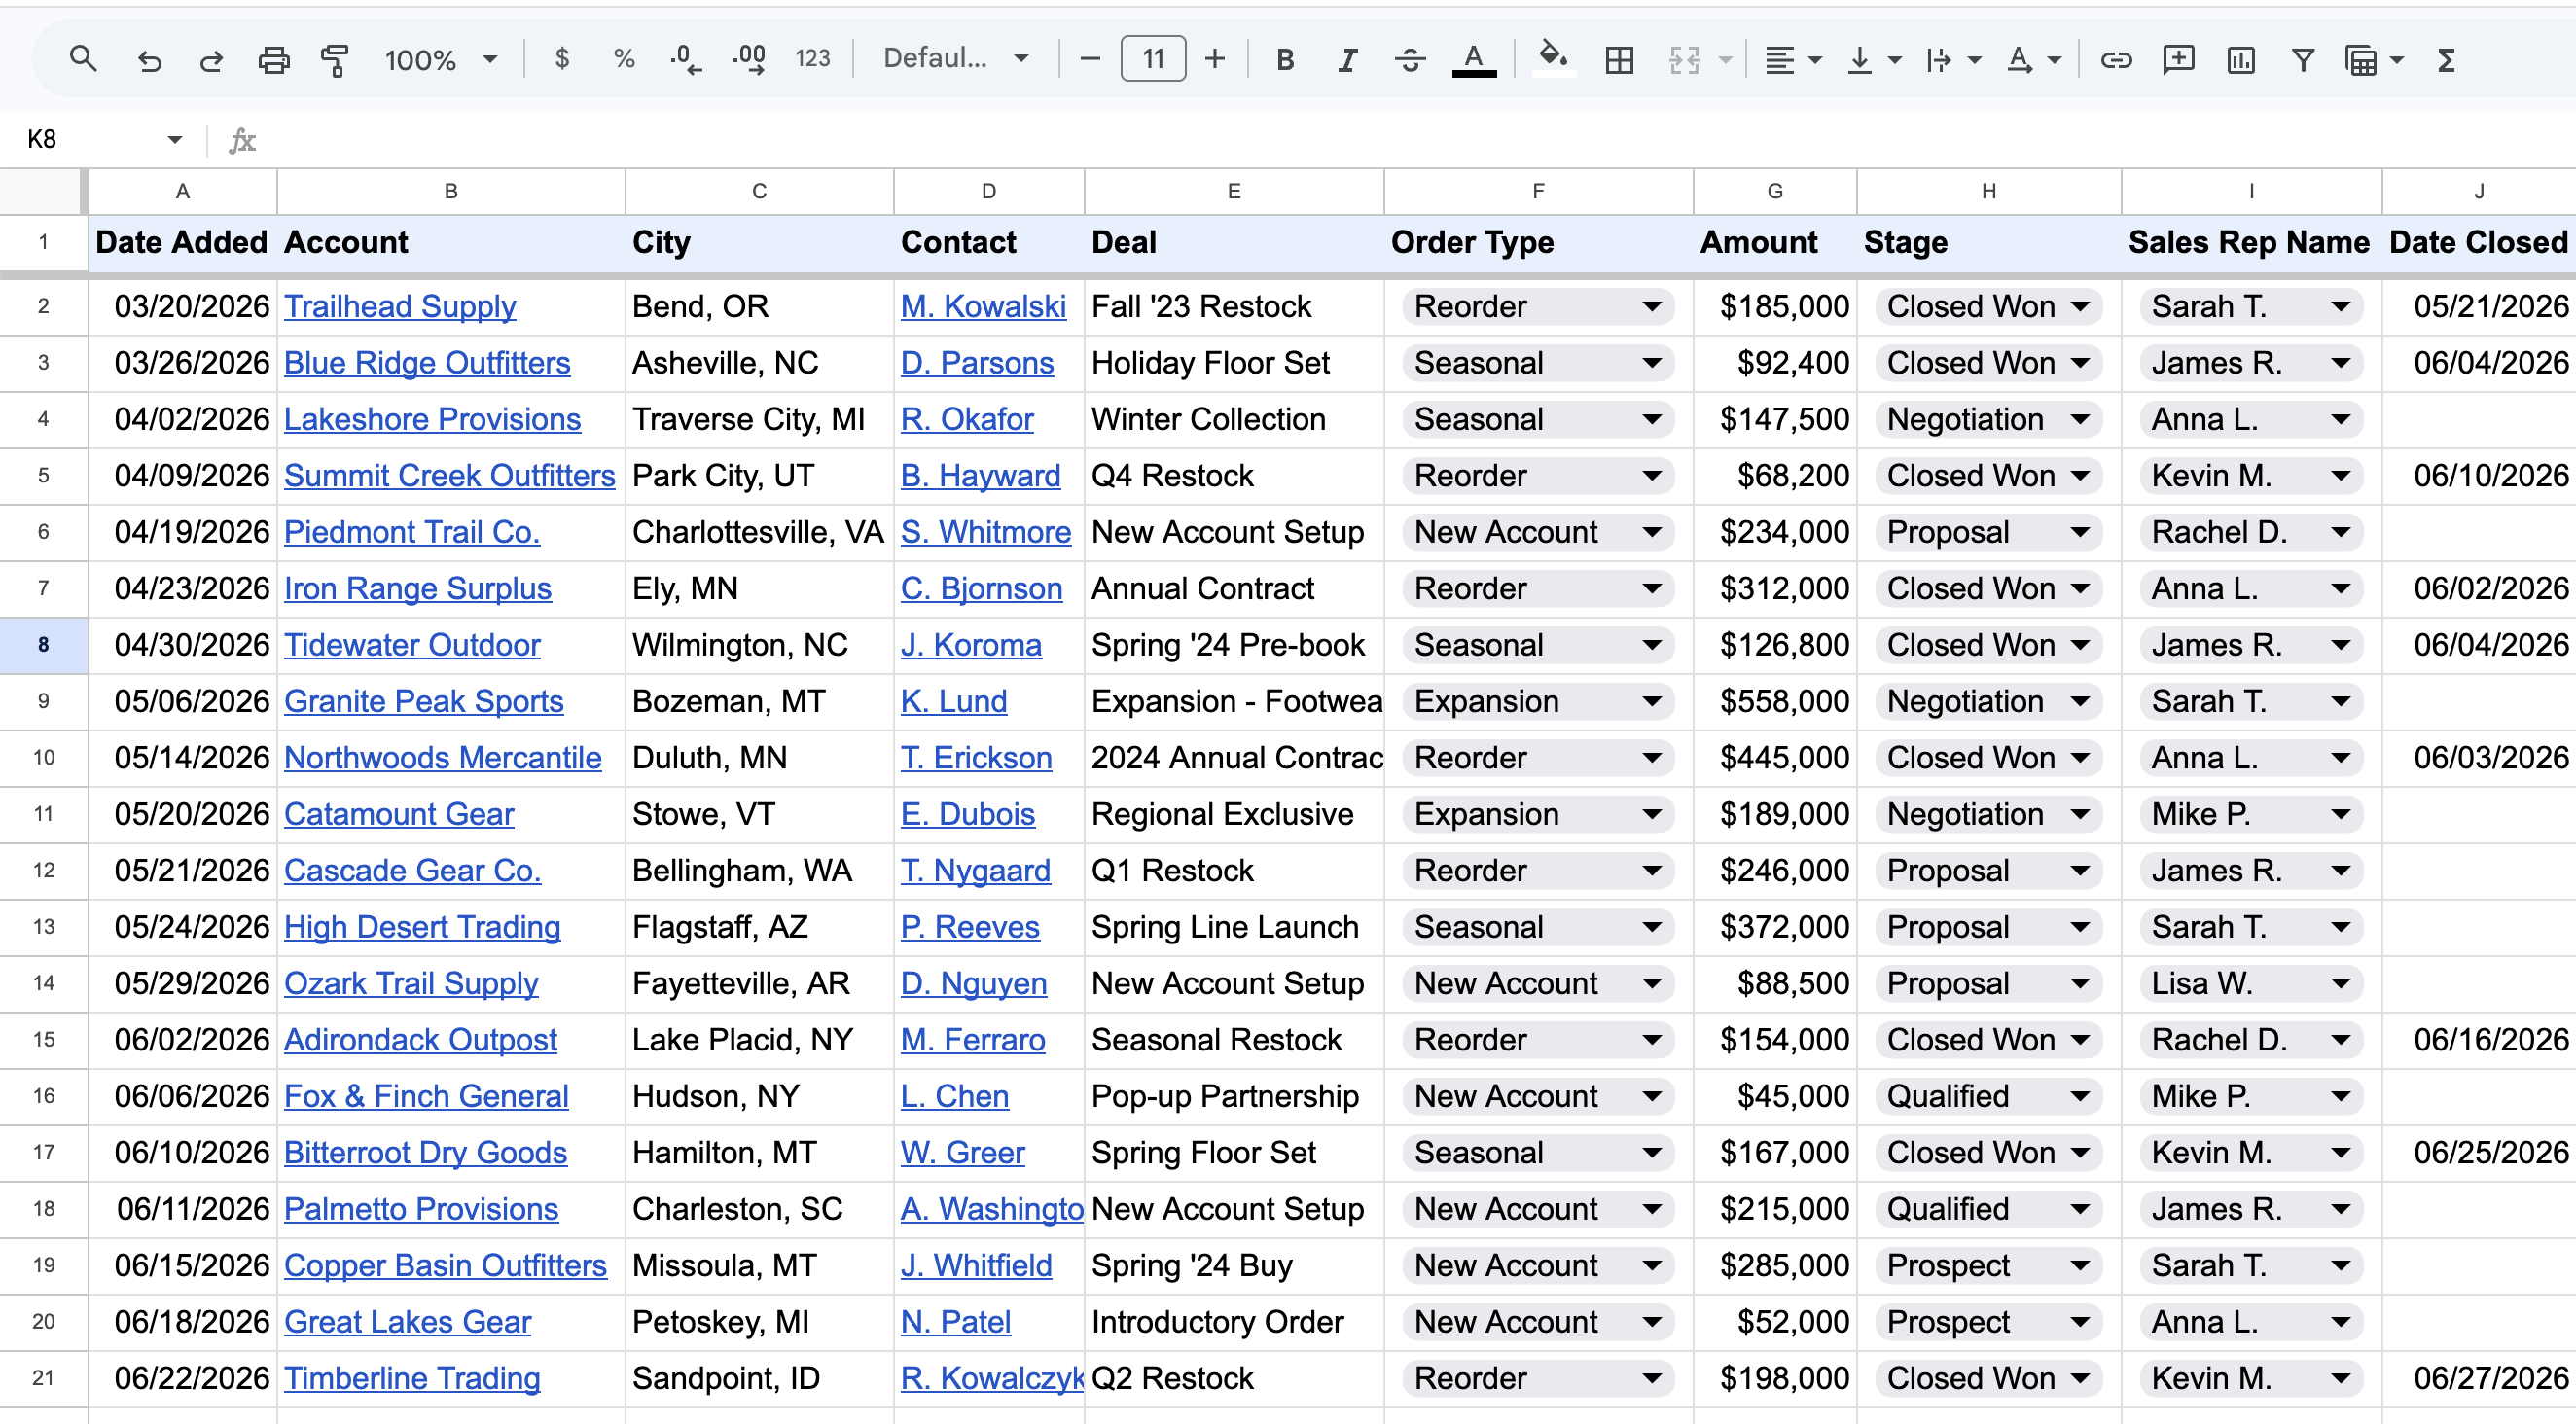
Upload spreadsheets, connect directly to databases, or sync from cloud sources like Google Sheets. No data warehouse required.
Dashbud's smart data loading handles formats automatically — type casting, date parsing, currency formatting — so your data is clean and queryable from the start. Every import is versioned and can be rolled back.
No data lake. No ETL pipeline. No migration project. Just connect what you have and start working.
Works with: CSV and Excel file uploads, Google Sheets, PostgreSQL, SQL Server, MySQL, Oracle, Redshift, and more.
Model Your Data Through Conversation
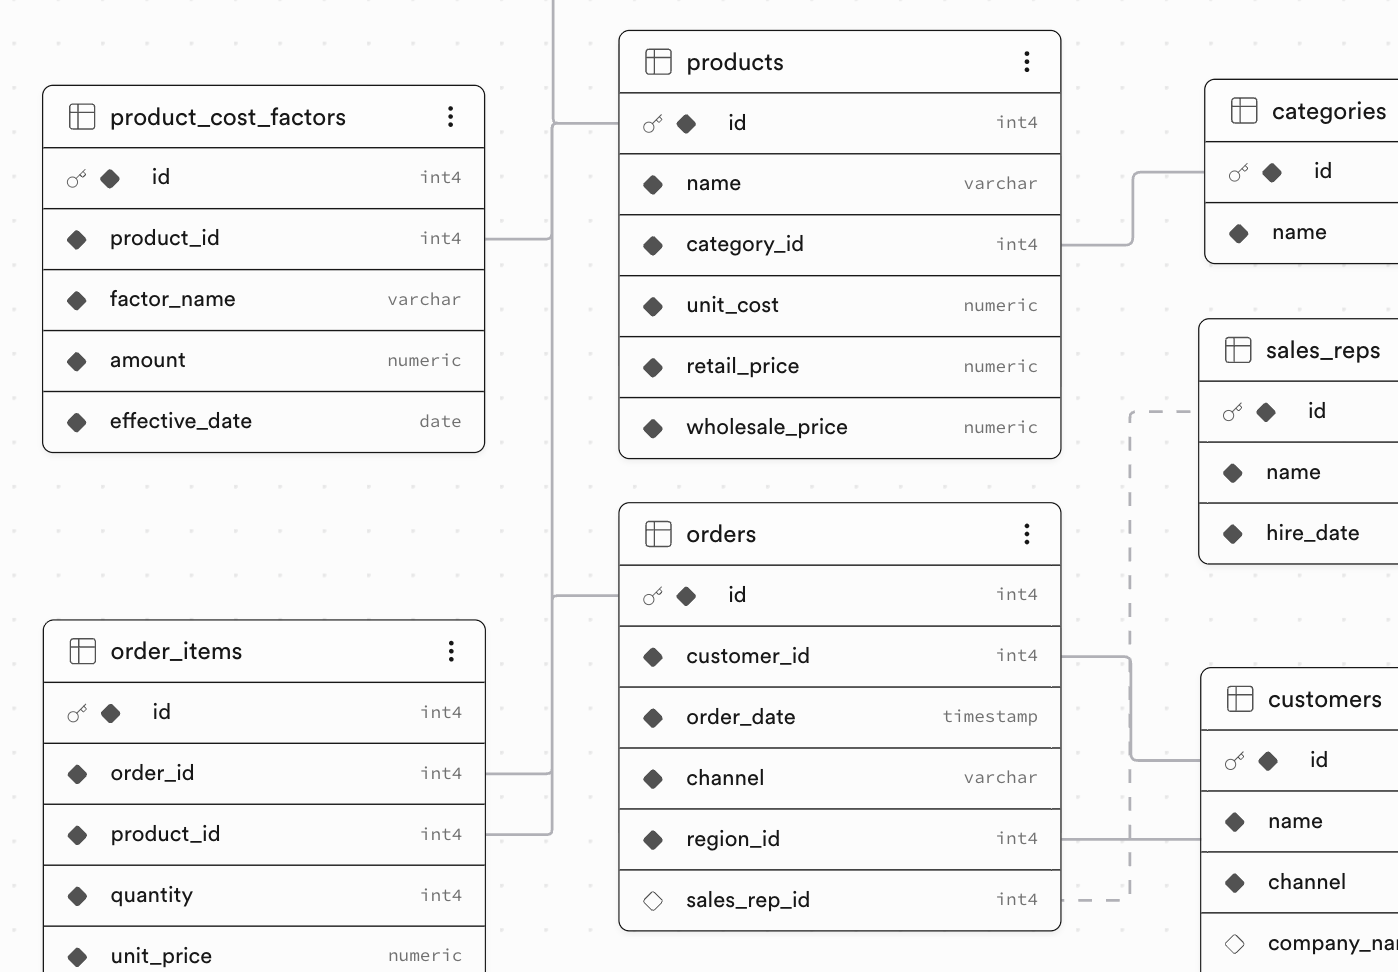
Set up a Semantic Model by telling Dashbud about your data in plain language. No code, no configuration files, no query language.
Tell Dashbud what your columns mean, how your tables relate, and what the business rules are. The AI asks questions, you answer them. Your semantic model becomes the foundation for every query — grounding the AI in your business context.
Model once, then clone and customize for different teams or projects. Your sales team gets their view. Finance gets theirs. Each workspace carries only the context it needs — no clutter, no confusion.
Ask Questions, Get Answers
Type a question in plain English and get back tables, charts, and insights — grounded in your semantic model, accurate every time.
Dashbud's Data Explorer writes the query, then produces a deterministic report — stable, accurate, and repeatable. Smart chart formatting automatically picks the right visualization, handles time series, and keeps legends readable.
Need interactive controls? Just ask Dashbud to parametrize any dimension — region, product line, date range — and your report becomes a live tool your team can use without touching a query.
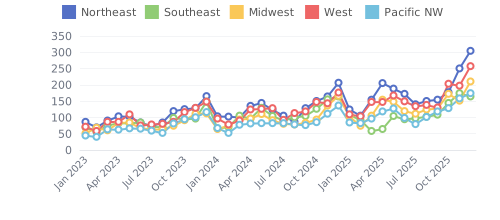
Please show me monthly DTC profits by region.
Total profit for each region on a monthly basis, computed as the difference between unit price and unit cost for all items ordered through the DTC channel, grouped by region and month.
The Right Tools for Every Role
Some users build. Some users explore. Some users review dashboards and reports. Data analyst, ops specialist, CEO: Dashbud gives all your users the access they need and the functionality they want.
Your data team models the data once. From there, clone workspaces for different functions — sales sees their pipeline, ops sees fulfillment, finance sees margins. Each team gets only the context they need, and the AI stays focused on their domain.
Control access at every level: who sees which data sources, which workspaces, which dashboards. From a single shared data foundation, everyone gets the right view.
Connect to all your data
Dashbud connects directly to databases like PostgreSQL, SQL Server, and Oracle, and to cloud warehouses like Snowflake, BigQuery, and Redshift. Import spreadsheets, connect Google Sheets or Airtable, or upload CSV and Excel files.
For business systems like SAP, Infor, and Epic, Dashbud connects directly to the underlying database or provides automated import workflows, and Dashbud supports hundreds of other platforms via API, database, or file export.






Bring your own AI.
Keep your guardrails.
Dashbud's API is built for AI agents. Point Claude, ChatGPT, or your own agent at a Dashbud workspace, and it can explore your data, run real analysis, and explain its work. It sees only what the workspace permits: governed query results, with your business rules applied. Never the database. Never anything out of scope.
- Scoped by workspace. An API key is tied to specific workspaces. The agent can see those sources, those tables, those columns, and nothing else.
- Your rules, every time. Every question runs through the semantic model. "Margin" means what your team decided it means, whether a person or an agent is asking.
- Auditable by design. Every answer comes back with the SQL that produced it. No black box between the question and the number.
 Dashbud · workspace: Forge & Frame Sales Dashbud · "Gross margin by quarter, 2024–2025" Dashbud · "Gross margin by wholesale account, Q1 vs Q2 2025" Dashbud · "Wholesale revenue share by account, trailing 12 months"
 Built for trust. Designed for privacy.
Dashbud's agent never reads your raw data — it works from your schema and semantic model to write queries, which run against your data directly. Reports are deterministic: once generated, they don't change or drift.
Your data stays in your database (for direct connections) or in Dashbud's managed infrastructure (for uploads). Every data import is tracked with full version history.
We don't share your data with third parties (including AI platforms) and we don't use it for training.
Built with your data needs in mind
Operations & Finance Leaders
You run reports every week from systems that weren't built for reporting. Dashbud sits on top of your ERP, your database, your spreadsheets — and gives you accurate answers from clean data without the manual work.
Data-Savvy Teams
You know your data better than anyone. Dashbud lets you model that knowledge once and share it across the organization — so you stop fielding one-off requests and start enabling self-service.
Executives & Stakeholders
You need the numbers, not the process. Dashbud gives you live dashboards and reports without having to ask someone to pull them. Interactive, up to date, and trustworthy.
Start getting answers in minutes, not months.
No six-month implementation. No data warehouse to build first. No training curriculum. Connect a data source, model it through conversation, and start asking questions. Most teams are up and running in days.
Get started today
Connect your data and start building reports in minutes — not months.